

For most boilers worldwide, environmental permitting agencies mandate that carbon monoxide (CO) emissions must be maintained below a prescribed limit. But boiler operators shouldn’t monitor CO just for environmental reasons; CO is also a measure of the effectiveness of the combustion process.
From a thermodynamics standpoint, the energy released from CO generation is only a third of the amount of energy released when the carbon in the fuel is completely combusted to generate carbon dioxide (CO2). Reducing CO generation thus results in increased heat release from the combustion process, which improves steam and power generation. Therefore, lowering/optimizing CO emissions should be adopted by all boiler operations teams to get the most energy out of the fuel that is being fired in the boiler. Optimizing combustion in boiler furnaces requires supplying the correct amounts of air in the right locations to achieve effective CO burnout. How can we determine this “correct” amount of air? In this blog post, we will answer this question.
There is generally an optimal level of O2 where the CO concentrations are minimized. If the O2 level is reduced beyond this optimal point, the boiler CO emissions quickly increase due to an insufficient quantity of O2 to support complete combustion. If the O2 level is increased past the optimal point, CO emissions can also sharply increase as the combustion temperatures, reaction rates, and residence times are reduced by the high excess air levels. This increase in CO at high O2 levels is sometimes referred to as “cold CO”. Therefore, for a given operating fuel mix, the plot of CO concentrations vs. O2 concentrations often shows a distinctive “U” shape, with the lowest CO emissions being at the optimum O2 level, i.e., the bottom of the “U”.
Every boiler has its own distinct “U” curve, and the O2 level at which CO is minimized will vary from boiler to boiler due to differences in furnace type and sizing, fuel, and the effectiveness of the fuel and air delivery systems. Figure 1 below shows a plot of real-time data collected by Jansen on a boiler, which clearly depicts the “U”-shaped relationship between the boiler’s CO and O2 concentrations.

Optimizing CO can occasionally become a challenge when boilers are subject to dual compliance limits for both CO and nitrogen oxides (NOx) emissions. In most solid fuel fired boiler applications, the major contributor to NOx emissions is the nitrogen content of the fuel. The higher the content, the higher the NOx generation and vice-versa.
However, NOx emissions also feature a linear relationship with O2, with operations at higher O2 levels resulting in increased NOx generation compared to operations at lower O2 levels. Therefore, achieving dual compliance with both CO and NOx emissions mandates requires that operations are maintained within a tight range of O2. Operators of boilers subject to dual compliance with CO and NOx emissions have often found this O2 range for their boiler by trial and error.
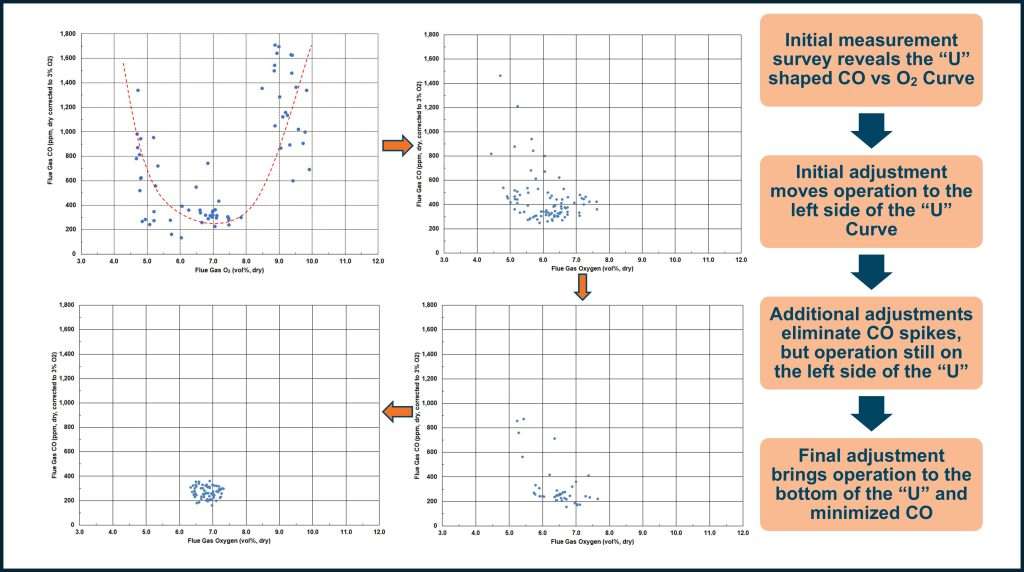
In a recent optimization tuning project in South America, Jansen engineers were asked to tune a biomass fired boiler which was experiencing combustion instability and elevated and unstable CO emissions. The operators didn’t have sufficient operating experience with this boiler to identify the correct operating parameters to produce the lowest CO emissions. An initial emissions measurement made with Jansen’s field instrumentation revealed that the existing operating parameters resulted in large variations in the flue gas O2 levels during typical operations, resulting in high concentrations of CO. The distinct “U” shape for this boiler at its untuned conditions is depicted in the top left corner of Figure 2 (below).
Jansen engineers implemented the tuning activities over the course of several days. During this time, Jansen worked with the boiler operators to adjust operating settings for the fuel and air delivery systems to stabilize combustion and bring operations toward the bottom of the “U” shaped curve. This gradual reduction in CO emissions is illustrated in Figure 2 (below), with the final adjustment and tuned “U” curve depicted in the bottom left corner. The tuning adjustments resulted in CO levels that were at the bottom of the “U”. Jansen’s tuning not only stabilized combustion and minimized CO emissions but also provided the boiler operators with knowledge of the operational settings that optimized combustion performance.
The efficiency gained from combustion optimization saves you money every day and helps to keep your operation a viable asset in the company’s fleet. Contact us to put Jansen’s extensive experience to work for you.
Authors: Samit Pethe – Manager, Process Technologies and Morgan Silverman – Process Engineer